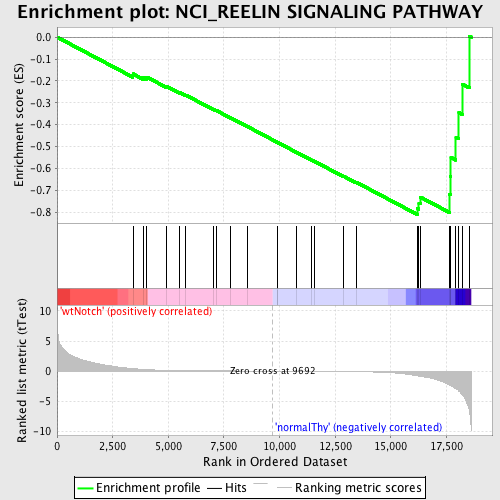
Profile of the Running ES Score & Positions of GeneSet Members on the Rank Ordered List
| Dataset | Set_03_wtNotch_versus_normalThy.phenotype_wtNotch_versus_normalThy.cls #wtNotch_versus_normalThy.phenotype_wtNotch_versus_normalThy.cls #wtNotch_versus_normalThy_repos |
| Phenotype | phenotype_wtNotch_versus_normalThy.cls#wtNotch_versus_normalThy_repos |
| Upregulated in class | normalThy |
| GeneSet | NCI_REELIN SIGNALING PATHWAY |
| Enrichment Score (ES) | -0.8109031 |
| Normalized Enrichment Score (NES) | -1.693314 |
| Nominal p-value | 0.0 |
| FDR q-value | 0.04228979 |
| FWER p-Value | 0.164 |
| PROBE | DESCRIPTION (from dataset) | GENE SYMBOL | GENE_TITLE | RANK IN GENE LIST | RANK METRIC SCORE | RUNNING ES | CORE ENRICHMENT | |
|---|---|---|---|---|---|---|---|---|
| 1 | MAPT | 360706 1230706 | 3411 | 0.426 | -0.1682 | No | ||
| 2 | ITGA3 | 4570427 | 3889 | 0.278 | -0.1839 | No | ||
| 3 | NCK2 | 2510010 | 4039 | 0.245 | -0.1831 | No | ||
| 4 | RELN | 6510037 | 4897 | 0.140 | -0.2242 | No | ||
| 5 | RAPGEF1 | 60040 4590670 | 5505 | 0.101 | -0.2532 | No | ||
| 6 | MAP2K7 | 2260086 | 5781 | 0.087 | -0.2648 | No | ||
| 7 | GRIN2B | 3800333 | 7035 | 0.047 | -0.3306 | No | ||
| 8 | PIK3R1 | 4730671 | 7165 | 0.043 | -0.3359 | No | ||
| 9 | AKT1 | 5290746 | 7808 | 0.031 | -0.3694 | No | ||
| 10 | GRIN2A | 6550538 | 8547 | 0.018 | -0.4084 | No | ||
| 11 | PIK3CA | 6220129 | 9883 | -0.003 | -0.4802 | No | ||
| 12 | LRP8 | 3610746 5360035 | 9894 | -0.003 | -0.4806 | No | ||
| 13 | PAFAH1B1 | 4230333 6420121 6450066 | 10756 | -0.016 | -0.5263 | No | ||
| 14 | RAP1A | 1090025 | 11445 | -0.027 | -0.5624 | No | ||
| 15 | VLDLR | 870722 3060047 5340452 6550131 | 11555 | -0.029 | -0.5672 | No | ||
| 16 | DAB1 | 2060193 7000605 | 12886 | -0.062 | -0.6365 | No | ||
| 17 | ARHGEF2 | 3360577 | 13443 | -0.085 | -0.6634 | No | ||
| 18 | MAPK8 | 2640195 | 16187 | -0.761 | -0.7836 | Yes | ||
| 19 | ITGB1 | 5080156 6270528 | 16264 | -0.811 | -0.7586 | Yes | ||
| 20 | FYN | 2100468 4760520 4850687 | 16323 | -0.850 | -0.7312 | Yes | ||
| 21 | CDK5 | 940348 | 17639 | -2.315 | -0.7189 | Yes | ||
| 22 | LRPAP1 | 5570253 | 17673 | -2.370 | -0.6356 | Yes | ||
| 23 | GSK3B | 5360348 | 17703 | -2.429 | -0.5500 | Yes | ||
| 24 | MAP3K11 | 7000039 | 17928 | -2.933 | -0.4568 | Yes | ||
| 25 | CBL | 6380068 | 18061 | -3.305 | -0.3453 | Yes | ||
| 26 | CRKL | 4050427 | 18209 | -3.866 | -0.2145 | Yes | ||
| 27 | CDK5R1 | 3870161 | 18529 | -6.586 | 0.0047 | Yes |

